FRED调用Matlab 点击:209 | 回复:1

简介:FRED作为COM组件可以实现与Excel、VB、Matlab等调用来完成庞大的计算任务或画图,本文的目的是通过运行一个案例来实现与Matlab的相互调用,在此我们需要借助脚本来完成,此脚本为视为通用型脚本。
配置:在执行调用之前,我们需要在Matlab命令行窗口输入如下命令:
enableservice('AutomationServer', true)
enableservice('AutomationServer')

结果输出为1,这种操作方式保证了当前的Matlab实体可以用于通信。
在winwrp界面,为增加和使用Matlab类型的目录库,我们需要如下步骤:
1. 在FRED脚本编辑界面找到参考.
2. 找到Matlab Automation Server Type Library
3. 将名字改为MLAPP
在Matlab里面有两种常用的数据发送选项PutWorkspaceData 及PutFullMatrix,PutWorkspaceData适用于存储一般的数据在工作区,并赋予其为变量,PutFullMatrix试用于复数数据。


现在将脚本代码公布如下,此脚本执行如下几个步骤:
1. 创建Matlab服务器。
2. 移动探测面对于前一聚焦面的位置。
3. 在探测面追迹光线
4. 在探测面计算照度
5. 使用PutWorkspaceData发送照度数据到Matlab
6. 使用PutFullMatrix发送标量场数据到Matlab中
7. 用Matlab画出照度数据
8. 在Matlab计算照度平均值
9. 返回数据到FRED中
代码分享:
Option Explicit
Sub Main
Dim ana As T_ANALYSIS
Dim move As T_OPERATION
Dim Matlab As MLApp.MLApp
Dim detNode As Long, detSurfNode As Long, anaSurfNode As Long
Dim raysUsed As Long, nXpx As Long, nYpx As Long
Dim irrad() As Double, imagData() As Double, reals() As Double, imags() As Double
Dim z As Double, xMin As Double, xMax As Double, yMin As Double, yMax As Double
Dim meanVal As Variant
Set Matlab = CreateObject("Matlab.Application")
ClearOutputWindow
'Find the node numbers for the entities being used.
detNode = FindFullName("Geometry.Screen")
detSurfNode = FindFullName("Geometry.Screen.Surf 1")
anaSurfNode = FindFullName("Analysis Surface(s).Analysis 1")
'Load the properties of the analysis surface being used.
LoadAnalysis anaSurfNode, ana
'Move the detector custom element to the desired z position.
z = 50
GetOperation detNode,1,move
move.Type = "Shift"
move.val3 = z
SetOperation detNode,1,move
Print "New screen position, z = " &z
'Update the model and trace rays.
EnableTextPrinting (False)
Update
DeleteRays
TraceCreateDraw
EnableTextPrinting (True)
'Calculate the irradiance for rays on the detector surface.
raysUsed = Irradiance( detSurfNode, -1, ana, irrad )
Print raysUsed & " rays were included in the irradiance calculation.
'When using real number data to send to MATLAB, it is simplest to use PutWorkspaceData.
Matlab.PutWorkspaceData("irradiance_pwd","base",irrad)
'PutFullMatrix is more useful when actually having complex data such as with
'scalar wavefield, for example. Note that the scalarfield array in MATLAB
'is a complex valued array.
raysUsed = ScalarField ( detSurfNode, -1, ana, reals, imags )
Matlab.PutFullMatrix("scalarfield","base", reals, imags )
Print raysUsed & " rays were included in the scalar field calculation."
'Calculate plot characteristics from the T_ANALYSIS structure. This information is used
'to customize the plot figure.
xMin = ana.posX+ana.AcellX*(ana.Amin-0.5)
xMax = ana.posX+ana.AcellX*(ana.Amax+0.5)
yMin = ana.posY+ana.BcellY*(ana.Bmin-0.5)
yMax = ana.posY+ana.BcellY*(ana.Bmax+0.5)
nXpx = ana.Amax-ana.Amin+1
nYpx = ana.Bmax-ana.Bmin+1
'Plot the data in Matlab with some parameters calculated from the T_ANALYSIS
'structure. Set the axes labels, title, colorbar and plot view.
Matlab.Execute( "figure; surf(linspace("&xMin &","&xMax &","&nXpx &"),linspace("& yMin &"," & yMax & "," & nYpx & "),irradiance_pwd, 'EdgeColor', 'None');" )
Matlab.Execute( "xlabel('X Position (" & GetUnits() & ")')" ) : Matlab.Execute( "ylabel('Y Position (" & GetUnits() & ")')" ) : Matlab.Execute( "zLabel( 'Irradiance' )" )
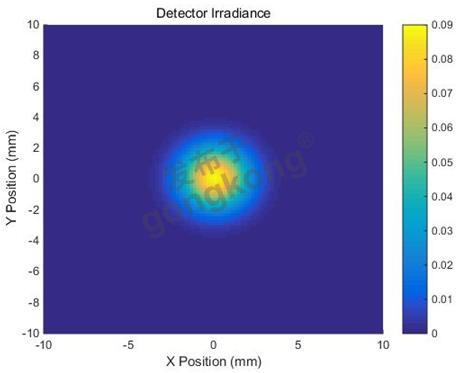
Matlab.Execute( "title('Detector Irradiance')" )
Matlab.Execute( "colorbar" )
Matlab.Execute( "view(2)" )
Print ""
Print "Matlab figure plotted..."
'Have Matlab calculate and return the mean value.
Matlab.Execute( "irrad = mean(mean(irradiance_pwd));" )
Matlab.GetWorkspaceData( "irrad", "base", meanVal )
Print "The mean irradiance value calculated by Matlab is: " & meanVal
'Release resources
Set Matlab = Nothing
End Sub
最后在Matlab画图如下:
并在工作区保存了数据:
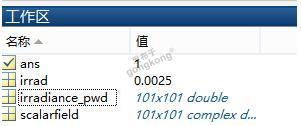
并返回平均值:

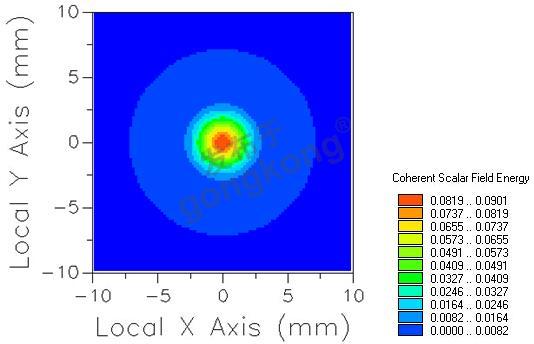
与FRED中计算的照度图对比:
例:
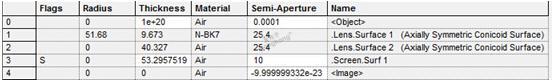
此例系统数据,可按照此数据建立模型
系统数据
光源数据:
Type: Laser Beam(Gaussian 00 mode)
Beam size: 5;
Grid size: 12;
Sample pts: 100;
相干光;
波长0.5876微米,
距离原点沿着Z轴负方向25mm。
对于执行代码,如果想保存图片,请在开始之前一定要执行如下代码:
enableservice('AutomationServer', true)
enableservice('AutomationServer')


楼主最近还看过

- 有朋友用过 GALAXY Lonworks...
 [611]
[611] - 数字孪生智慧物流之 Web GIS...[944]
- 求:那里可以找到CPU313 型号...[290]
- 新一代企业级实时历史数据库...[1824]
- 如何学编程语言?好菜鸟学习编...[483]
- 常用±45度双线极化基站天线的...[366]
- 求富士公司的MICREX-F Progr...[772]
- The memory space in the mo...[1192]
- 智能传感器----电容式油量表...[227]
- Modbus读写器YW-630开发指南[456]

官方公众号

智造工程师
-

 客服
客服

-

 小程序
小程序

-

 公众号
公众号


 工控网智造工程师好文精选
